
Case Studies
Overheating Electric Motors: One Root Cause of Insulation Failure

Modern Plant Management widely accepts predictive maintenance as a significant source of cost savings. However, preventive maintenance is still viewed as an alternative. This fact is based upon yesterday’s technologies being unable to succeed at root cause analysis. With respect to the diagnostic electrical tool belt, the days of the handheld multi-meter and the meg-ohm meter as sole tools in cost effective maintenance is over. Modern on-line technologies permit easy assessment of the whole motor system, which is comprised of the power, motor and load.
By focusing on the whole motor application instead of one or two components, true troubleshooting solutions become available.
Professional Standards
Maintenance experts agree that excessive heat cause rapid deterioration of the winding insulation within motors. The common rule states, for every 10oC of additional heat to the windings, the insulation life is cut in half. For example, a motor that would normally last 20 years in regular service is running 40oC above rated temperature.
Under these conditions, the motor would have a life of 1/16 or about one year the length as it would have if it were running at rated temperature. Many articles and studies have been done that agree with this rule. Leading standardization organizations have come to the conclusion that 30% of motor failures are contributed to insulation failure and 60% of these are overwhelmingly caused by overheating. Also other organizations have published article stating that a significant cause of bearing deterioration is overheating.
There are typically five main reasons for overheating. These items include overload, poor power condition, high effective service factor, frequent stops and starts, and environmental reasons.
Overload Conditions
Stator current is a frequently used measurement of load level but it can easily be masked by an overvoltage condition. A common mistake is made in the practice of operating at an over-voltage in order to reduce the stator current. The hope is to proportionally reduce the introduction of heat. It has been shown that for motors ranging from 10 to 200hp, that the decrease of losses obtained by operating at a 10% overvoltage would typically be only 1 to 3%.
Even though the current of a motor may vary strongly when applying over-voltages, the excessive damaging heat in the motor will not improve. A more than 10% load error can be introduced due to relying on stator current readings to access probable load and expected heat levels. Under full load conditions, this can mean life and death to a motor.
In an example taken from a coal-fired power plant in the United States, a 7000 hp 6.6kV motor was running with only 7% over current, but with an 8% over voltage. Two identical applications had previously undergone unscheduled outages within the last 12 months. Looking at the stator current of this motor, a mild overload had been identified. Only after looking at the true load to the motor, was an overload of nearly 20% discovered. This explains why these motors were failing. The repair for each of these motors ran in the hundreds of thousands of dollars.
Under industrial applications, perfect voltage conditions are rare. One must remember that losses, and not current level alone, are the true source of heat. These losses are a destructive factor to windings and represent a significant reason for bearing damage.
This justifies the need for accurate knowledge of operating load level. Only accurate load level calculations can give reliable measurements of excessive losses and overheating in the motor. This permits effective use in preventive maintenance environments.
Power Condition
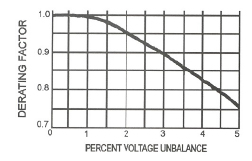
Due to typical poor power conditions within manufacturing plants, electric motors generally need to be derated in order to maximize useful life. NEMA MG-1 sections II and IV specify what voltage quality, as a function of balance and distortion, allows what level of percentage load. Figure 1 shows the NEMA derating curve for percentage of unbalance. This figure is also defined in the following formula:

The use of the derating curve is best described as the higher the level of unbalance, the lower the acceptable level of steady state load. For example: If you had a 100 hp motor and an unbalance factor of 3%, you would need to derate the motor to 0.9 or 90% of capacity, meaning 90 hp.
The frequent use of Variable Frequency Drives (VFD’s) is showing detrimental effects to electric motors due to the condition of power within manufacturing facilities. Figure 2 shows the voltage that a VFD, running at almost a 6-pulse mode, will send to the motor. The distorted currents are the motors reaction to the poor power condition. Very severe distortions are evident. This scenario shows a NEMA derating of 0.7. This allows the motor to be operated at 70% output.
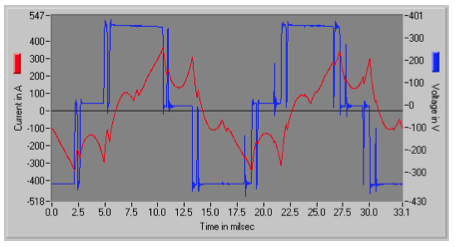
Fig 2: Extreme distortion with a slow switching VFD (50hp, 4-pole)
Effective Service Factor
Bringing voltage and current level, operating speed and input power standards to the field is no trivial matter. Until recently there has been no accurate measurement based load estimation method. The key to finding the most frequent reasons of overheating is proper load level identification. To perform this, it is crucial to have the best possible accuracy in the estimation of load level. This can be obtained by looking at only currents and voltages. In the past, less accurate methods lead to wide mis-assessments, in particular in cases where voltage conditions lack optimal level, balance and distortion. Unfortunately these conditions are common in the field.
The formula for calculating effective service factor is:
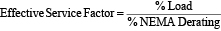
The key benefit effective service factor offers is the combination of professional standards and real life applications. This allows predictive maintenance professionals a solid conclusion of stress on any particular motor-load application. From data gathered on a dynamometer a 300hp motor under test was running a nearly full load, 99.7%.
Voltage distortion was poor due to a previously unidentified SCR defect in the power supply. The resulting NEMA derating factor of 0.85 renders to an effective service factor of 1.17, which signaled an alarm condition. Regardless of nameplate service factor (s.f.), any motor operating above 1.0 s.f. is under stress. Higher s.f. signifies the motor’s capability for over load for short periods of time, not higher steady state operating capabilities. Poor voltage conditions are frequent and can be caused by a variety of reasons. NEMA specifies which load level is permitted for poor voltage conditions. Only Preventive Maintenance on-line tools capable of accurately calculating operating load ensure plant operation with healthy limits.
Frequent Starts and Stops
Table 1 displays the maximum number of starts and stops for line-operated motors as a function of their rating and speed. This illustrates that limiting the frequency of startup, the most stressful portion of motor operation, is highly important. Many well documented cases of recurring motor failure was approached by increasing the horsepower rating of the motor. This shortened the time between failures, however; the root-cause of the failure was the frequency of starts and stops. The key is to closely monitor the number of starts, hourly for small or medium motors, and daily for larger motors.
| 2-Pole | 4-Pole | 6-Pole | ||||
|---|---|---|---|---|---|---|
| HP | A | C | A | C | A | C |
| 1 | 15 | 75 | 30 | 38 | 34 | 33 |
| 5 | 8.1 | 83 | 16.3 | 42 | 18.4 | 37 |
| 10 | 6.2 | 92 | 12.5 | 46 | 14.2 | 41 |
| 15 | 5.4 | 100 | 10.7 | 46 | 12.1 | 44 |
| 20 | 4.8 | 100 | 9.6 | 55 | 10.9 | 48 |
| 50 | 3.4 | 145 | 6.8 | 72 | 7.7 | 64 |
| 75 | 2.9 | 180 | 5.8 | 90 | 6.6 | 79 |
| 100 | 2.6 | 220 | 5.2 | 110 | 5.9 | 97 |
| 200 | 2 | 600 | 4 | 300 | 4.8 | 268 |
| 250 | 1.8 | 1000 | 3.7 | 500 | 4.2 | 440 |
A= Maximum Number of Starts per Hour
C= Minimum rest or off time in seconds between starts
Modern on-line testing can ensure full compliance to professional standards. It identifies reasons of failure when facing an operation that does not comply with standards by including these standards into long term unsupervised monitoring.
Environmental Conditions
Thermography is frequently used to determine the heat that electric motors are being used under. Poor cooling due to high ambient temperature, clogged ducts, etc, are typical examples of non-electrically induced temperature stress to both the motor and insulation system. Chemical abrasive substances in the air, wet operation, and high altitude operation are a few common environmental stresses.
Conclusions
Bearing and winding failures are the most common motor failures. The fundamental reason is excessive heat. Today’s preventive maintenance practices frequently limit on-line electrical measurements to interpret current levels. While tremendously important, this method is inconclusive in many of the failures caused by excessive winding heat. The best way to ensure successful preventive maintenance and monitoring is to test according to NEMA and other professional standards.
Effective service factor has been found to be a good measurement allowing difficult standards to be interpreted for day-to-day plant operation. Even though instrumentation has not been available to monitor the frequency of starts and stops, it is an important point in motor integrity. Automated assessment is necessary to effectively ensure motor health. The more successful root cause analysis of motor failure or stress, the more suitable predictive maintenance becomes for plant management. This point represents good news for business; since electrical on-line monitoring technology has successfully become an equal partner with vibration in ensuring plant operation and up time.